

Industry growth trends across Australia and New Zealand
Economic conditions remain challenging, but growth isn’t happening evenly. Experian data highlights where momentum is building and what suppliers may want to keep on their radar.
Businesses across Australia and New Zealand continue to operate in a challenging environment.
In Australia, unemployment increased to 4.7% in September and the RBA raised the cash rate to 4.60%. Business confidence has also weakened, with almost half of businesses saying now is a bad time to invest.
But the picture isn’t the same across every industry.
Experian’s October 2026 Business Pulse Monthly highlights several sectors where growth is continuing despite the broader uncertainty. For suppliers looking for new business opportunities, these trends can provide useful context when considering which industries and markets to explore.
How does Experian measure industry growth?
Experian’s Growth Index uses Trade Bureau business-to-business payment data and Spend Analytics consumer spending data to provide a measure of business performance.
It provides both a one-year and three-year view of growth, with industries grouped into five bands:

So, where is the momentum?
Australia: digital, healthcare and professional services stand out
Across Australia, the one-year Growth Index was higher than the three-year measure for most sectors, pointing to stronger recent momentum across much of the economy. Media and Telecommunications and Education and Training recorded the highest broad-sector one-year scores at 118, followed by Professional & Technical Services at 115.
Digital and data
Some of the strongest results appear when looking more closely at digital and data-related industries.
Data Processing, Web Hosting & Electronic Information Storage recorded a one-year Growth Index of 144, while Software Publishing reached 135 and Computer System Design & Related Services 129. Market Research & Statistical Services also recorded strong growth at 124.
Rather than being concentrated in one area, the results indicate momentum across several parts of Australia’s digital ecosystem, from infrastructure and software to data and technology services.
Healthcare and community services
Healthcare also shows relatively broad-based growth.
Health Care & Social Assistance recorded a one-year index of 111 and the highest three-year Growth Index of any Australian broad sector at 110. The number of Australian healthcare businesses also increased 6.7% over the last financial year, compared with 3.1% across all industries.
The growth extends across the healthcare supply chain. Pharmaceutical and Medicinal Product Manufacturing recorded an index of 122, Pathology and Imaging Services 114, Medical Services 113 and Hospitals 112.
Construction and infrastructure
There are also areas of momentum within construction.
Heavy and Civil Engineering recorded a one-year Growth Index of 123, while Land Development & Site Preparation reached 112 and Non-Residential Building 110.
This is reflected in broader activity data, with the value of building work completed in Australia increasing from $165 billion in FY25 to $179 billion in FY26.
New Zealand: construction leads the way
New Zealand presents a more mixed picture.
Construction recorded the country’s highest broad-sector one-year Growth Index at 110, followed by Professional & Technical Services at 108 and Rental & Real Estate Services at 107. Within construction, the differences are even more pronounced.
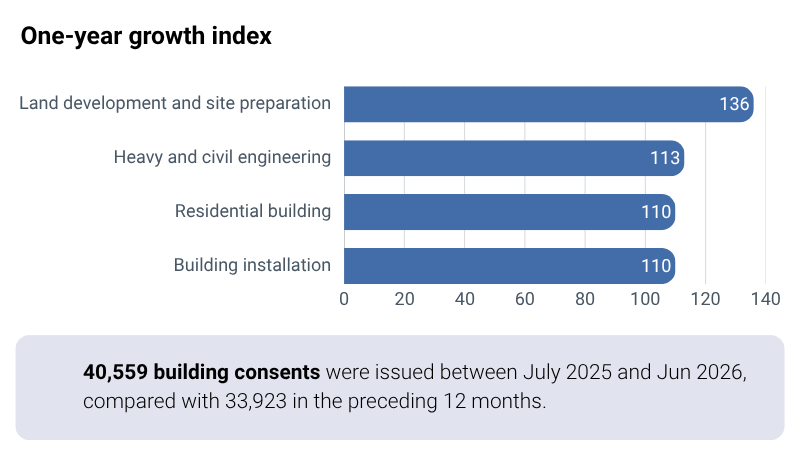
What this means for suppliers: The October 2026 Growth Index indicates momentum in parts of New Zealand’s construction sector, particularly across land development and infrastructure-related activity. For businesses supplying into these areas, it may be worth keeping these sectors on your radar.
Growth and risk can exist at the same time
For suppliers, stronger industry growth is only part of the picture.
Australia recorded 1,222 company insolvencies in September. Construction insolvencies were 28% higher year-on-year, while Manufacturing, Professional Services and Transport & Warehousing were each 18% higher than in September the previous year.
Experian’s Commercial Risk Barometer also increased for a second consecutive month in September.
The takeaway is an important one: industry growth doesn’t remove the need to assess individual opportunities carefully. When pursuing new customers or contracts, consider the commercial conditions alongside the potential opportunity.
What could this mean for suppliers?
Industry data can help add another layer of context when you’re deciding where to focus your business development activity.
- Review the industries you target
If your products or services can support several sectors, consider whether emerging areas of growth could broaden the markets you monitor. - Think beyond the headline industry
Growth can extend through a wider supply chain. Healthcare, for example, encompasses manufacturing, wholesale distribution, diagnostics, medical services, care and other supporting services. - Keep your TenderLink profile and categories up to date
Review the categories and regions relevant to your business so they’re aligned with the types of opportunities you want to find. - Balance opportunity with commercial awareness
A growing industry isn’t necessarily a low-risk industry. Consider each opportunity and prospective customer on its own merits rather than relying on broader sector performance alone.
Keep an eye on where opportunities are emerging
Market conditions will continue to change, but understanding which industries are showing momentum can give suppliers another useful perspective when deciding where to focus.
Explore the full Experian Business Pulse Monthly, October 2026 for more insight into the economic and industry trends shaping Australia and New Zealand.
Interested in finding out more?
Have a chat to our friendly team on 1800 233 533 (AU) / 0800 698 363 (NZ) or ask us here.
Disclaimer: This article is provided by Experian Australia Pty Ltd / Experian New Zealand Operations Limited (“Experian”) as general information and it is not (and does not contain any form of) professional, legal or financial advice. Experian and its related bodies corporate make no representations, warranties or guarantees that the information (including links and the views / opinions of authors and / or contributors) contained in this article are error free, accurate or complete. You are solely responsible and liable for any decision made (or not made) by you in connection with the information contained in this article. Experian (and its related bodies corporate) exclude, to the extent permitted by law, all liability for any and all loss, cost, expense, damage or claim incurred by a party as a result of or in connection with (whether directly or indirectly) this article or any reliance on the information in this article or links contained within. Nothing in this disclaimer excludes, restricts or modifies any rights or remedies that cannot be excluded, restricted or modified under applicable law. Experian and its related entities own, or are licensed to use, the intellectual property rights in this article and its contents. Except as permitted by law, the contents of this article must not be reproduced, modified, distributed or republished without Experian’s prior written consent. Experian and the Experian marks used herein are service marks or registered trademarks of Experian or its related entities worldwide. Other product and company names mentioned herein are the property of their respective owners. © 2026 Experian Australia Pty Ltd and / or Experian New Zealand Operations Limited. All rights reserved.